Wednesday, September 16, 2015

Djangui and Wooey have merged

A little bit ago, I released a project named Djangui, which aims to assist programmers in sharing their scripts with non-programmers (or just let you use your programs with an auto-generated history). Another project, with similar aims, was Wooey, created by Martin Fitzpatrick. After a bit of discussion with Martin, we decided to merge the projects together to make something even more awesome. For a name, we decided to keep Wooey as the branding, but utilize the backend of Djangui since we were both more comfortable using Django and there were a few decisions made in the creation of Djangui that helped support distributed servers and such. Well, enough history. Let's get to Wooey.

For the impatient, you can play with Wooey here (note: you may encounter a server error on the first or second attempt to connect, as the app is hosted on a free plans):

https://wooey.herokuapp.com

And to see the code:

https://www.github.com/wooey/wooey

Wooey, a web UI for your scripts

So, what does Wooey do? Simply put, Wooey takes your scripts:


And converts it to this:

Wooey achieves this by parsing scripts created with command line interface modules, such as argparse. This is achieved through a separate project within the Wooey domain, clinto. Though argparse is really the only command line interface really supported at the moment, we are going to expand clinto to support parsers such as click in the very near future (likely within the next 2 months). Importantly, this is painless for the programmer. A major feature of Wooey is there is no markup language to learn, and users can update scripts through the Django admin in addition to the command line. Scripts are versioned, so jobs and results are reproducible, a much needed feature for any data analysis pipeline.

Job Submission with Wooey

As shown above, Wooey provides a simple interface for using a script, and tracks the status of a script's execution and its output:


From here, there are several useful features for any data analysis pipeline:
  • Outputs from a script and inspected for common file formats such as tabular data or images, and shown if found.
  • Jobs may be shared with users via a unique public url (uuid based, so these are fairly safe against people guessing your job's results) or downloadable as a zip or tar archive
  • Jobs may be cloned, which will bring a user to the script submission page with the cloned job's parameters automatically filled in -- thus saving time for running complicated scripts by prepopulating settings.
  • Jobs may be rerun or resubmitted to handle cases where a worker node crashed, or other reasons things might just break.
Additionally, for users who create an account, there are more features that allow further customization and ease of use:

  • The output of a job can be added to a 'scrapbook', for easy storage of useful output in a centralized place:
  • The ability to 'favorite' a script to create your own custom list of commonly utilized tasks.

Other Wooey Features

  • For script finding, a user may search for a script:
  • All jobs submitted may be viewed in a Datatable, allowing the user to easily find a previous submission:
And probably a few more I missed.

Wooey's Arcitecture

Wooey can be run in several configurations. It can be deployed on a local server with all assets being served by a single machine, but it can also be used on distributed systems with unique configurations such as an ephemeral file system. Thus, Wooey is very scalable for any data analysis needs. To assist in this, we have created several guides for setting up wooey on Heroku, Openshift, and moving various components of Wooey to Amazon (and we are open to pull requests for guides on setting up Wooey on any platform we missed!).

Future plans

There are a ton of plans for Wooey, many which can be seen here. Some notable ones include the ability to load all scripts from a url or a package on pypi, a significantly upgraded user dashboard, more real-time capabilities, and the ability to combine scripts and jobs into a complex workflow.

Contributions

Contributions, suggestions, bug reports, etc. are all welcome on our github repository.

Thursday, July 30, 2015

Dynamically render multiple initial values as multiple widgets in Django

An upgrade I made for the merger of Djangui and Wooey was to deal with instances where multiple arguments could be passed to a parameter. Djangui is a program that wraps python scripts in a web interface, so forms are dynamically built according to the argparse commands. However, for cases where you have an arbitrary number of arguments to a parameter, such as providing multiple files separated by spaces on the command line, we need slightly more than the standard input. This is complicated by supporting custom widgets that are in 3rd party apps -- we don't want to assume anything about what the widget's output is.

For me, a complete solution required several aspects:
  • The ability for the user to arbitrarily add extra fields
  • A limit of the number of fields if specified by the script
  • A way to clone past jobs and auto-populate multiple selections

Adding extra fields and limiting the number of extra fields

To add extra attributes to a widget that are rendered in HTML is quite easy. You simply add whatever you wish to show up in the widget's attr dictionary as such:

field.widget.attrs.update({'data-attribute-here': 'data-value-here'})

This allows you to then do any work on the front-end with javascript, such as putting in checks for the maximum number of extra fields with code such as:

field.widget.attrs.update({'data-wooey-choice-limit': choice_limit})

For adding extra fields, this isn't exactly what I want though. This approach will put the attribute on every single widget. To make this clear, this is the final implementation:


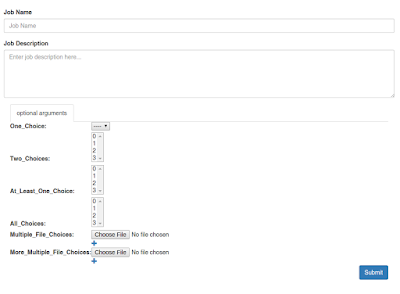
You can see there are plus signs for two parameters that support multiple file inputs. If we put that extra attribute on the widget, we would create a + sign for every single widget of the parameter instead of a single button that is "add a new input for this field". To avoid this, we'd have to do a bunch of checks in javascript to see which widget is the last one, etc. That is too complicated to be correct.

To get around this, I chose to wrap the input field with a div. This is accomplished by patching the widget's render method to:
  • Get the rendered content
  • Wrap that content with an element
This is what it looks like:

WOOEY_MULTI_WIDGET_ATTR = 'data-wooey-multiple'
WOOEY_MULTI_WIDGET_ANCHOR = 'wooey-multi-input'

def mutli_render(render_func, appender_data_dict=None):
    def render(name, value, attrs=None):
        if not isinstance(values, (list, tuple)):
            values = [values]
        # The tag is a marker for our javascript to reshuffle the elements. This is because some widgets have complex rendering with multiple fields
        return mark_safe('<{tag} {multi_attr}>{widget}</{tag}>'.format(tag='div', multi_attr=WOOEY_MULTI_WIDGET_ATTR,
                                                                widget=render_func(name, value, attrs)))
    return render

# this is a dict we can put any attributes on the wrapping class with
appender_data_dict = {}
field.widget.render = mutli_render(field.widget.render, appender_data_dict=appender_data_dict)

Now we can look for the data-wooey-multiple attribute, which corresponds to a div containing all inputs for a given field. This lets us easily count how many copies of the field the user has created to help enforce limit checks, as well as makes it so a single selector can be constructed to handle everything.

Auto-populate multiple initial values

This aspect of this implementation was accomplished by extending my previous approach of overriding the render method. First, I made it so all my initial values would be passed as a list. Given this, it was simple to expand my above render method, into this:

def mutli_render(render_func, appender_data_dict=None):
    def render(name, values, attrs=None):
        if not isinstance(values, (list, tuple)):
            values = [values]
        # The tag is a marker for our javascript to reshuffle the elements. This is because some widgets have complex rendering with multiple fields
        pieces = ['<{tag} {multi_attr}>{widget}</{tag}>'.format(tag='div', multi_attr=WOOEY_MULTI_WIDGET_ATTR,
                                                                widget=render_func(name, value, attrs)) for value in values]

        # we add a final piece that is our button to click for adding. It's useful to have it here instead of the template so we don't
        # have to reverse-engineer who goes with what

        # build the attribute dict
        data_attrs = flatatt(appender_data_dict if appender_data_dict is not None else {})
        pieces.append(format_html('', anchor=WOOEY_MULTI_WIDGET_ANCHOR
                                  ,data=data_attrs))
        return mark_safe('\n'.join(pieces))
    return render

Unfortunately, it wasn't that simple. By default, a field's clean method takes the first element of a list as its output, which clearly will fail here since we can have multiple items. Additionally, a widget's value_from_datadict method will usually return the first element in the list as well. To avoid subclassing every single widget to correct this behavior, I once again took my monkey-patch/decorator hybrid method to override the clean and value_from_datadict methods:

def multi_value_from_datadict(func):
    def value_from_datadict(data, files, name):
        return [func(QueryDict('{name}={value}'.format(name=name, value=i)), files, name) for i in data.getlist(name)]
    return value_from_datadict

def multi_value_clean(func):
    def clean(*args, **kwargs):
        args = list(args)
        values = args[0]
        ret = []
        for value in values:
            value_args = args
            value_args[0] = value
            ret.append(func(*value_args, **kwargs))
        return ret
    return clean

field.widget.value_from_datadict = multi_value_from_datadict(field.widget.value_from_datadict)
field.clean = multi_value_clean(field.clean)

Summary

The above approach allows the user to add widgets to a given field at will, with the option to limit how many can be added. It also has the very useful attributes of:
  • It will work on most field widgets (if they for some reason changed the render method's expected arguments, it may fail).
  • It utilizes existing clean methods to perform validations.
  • It will generate correct errors for each field without any extra work.
The full implementation of this can be seen at the merger branch of Wooey and Djangui, here.

I'm not sure if my method of overriding the function is best called a monkey-patch or a decorator, it seems a bit of both to me. If anyone knows the correct term, let me know.

Tuesday, May 26, 2015

Djangui, empower your python scripts with Django!

Djangui is a Django app which converts scripts written in argparse to a web based interface.

In short, it converts this:


Into this:


If you just want to go out and play with it now, you can do so here:

https://djangui.herokuapp.com

Note: this is on a free heroku plan, so it may take ~20 seconds to spin up or you may have to refresh if the site is initially unresponsive.

And if you like what you see, you can see how to install it here:


So, what is it?

I quite often have to do things which are minimally related to my day to day work, usually involving handling other's data. In biology, there is an exponential increase in the datasets, and most biologists are limited by what can be opened in excel. Even then, they are limited to small datasets because even if you can open 1 million rows in your latest excel, doing useful analysis of it is another story (such as waiting 5 hours to group things).

So basic tasks, like:

  • I want to make a heatmap
  • I want to do a GO analysis
  • I want to do a PCA analysis
  • I want to group by X, and make a histogram
and other similar tasks, are out of reach. Traditionally, you sought out your resident bioinformatician or someone who 'I've seen use the command line before', or tried to find something online.

Because I didn't want to make heatmaps for people (which also, makes them realize making a heatmap of 80,000 rows x 50 columns is pointless unless you are displaying your graph on an imax), I wanted to make a system which enables others to use my scripts without my involvement. There are existing tools to do this with the interests of biologists in mind, such as galaxy or taverna. However, my fundamental issue with these programs is they make me write a wrapper around my scripts in their own markup language. I don't want to learn a platform specific language which has no relevant role in my day-to-day life. Knowing this language is purely altruistic on my end, and doesn't expedite my workday any.

Enter, Djangui

So, there is a wonderful library for building command line scripts in python, argparse. Given its fairly structured nature, I thought it would be fairly straight forward to map these structures to a web form equivalent (it wasn't too hard). This project was initially inspired by what power sandman could leverage over a sql database in a single command. Guided by this 'it should be simple' ideology, djangui will fully bootstrap a Django project with djangui pre-installed for you in a single command:


djanguify.py -p ProjectName

From here, Djangui leverages the awesome Django admin to control adding scripts as well as managing their organization. Scripts are classified into groups, such as plotting tools/etc., and user access to scripts can be controlled at the script group as well as the script level.


A Sample Script

After adding a script, your basic interface appears as so:


There are three aspects of the front-end:
  • Your script groups
  • Your currently selected script: We are currently using the 'find cats' script, which will find you cats.
  • A summary of past, on-going, and queued jobs. Tasks can be further viewed in here by clicking on their task name (its also a datatables table, so it's nicely sortable and queryable). 


Task Viewing

The task viewer has several useful feature. From the aforementioned 'find cats' script (also: how to cheaply get undeserved attention from the internet):

File Previews:

Currently there are three types of files we attempt to identify and embed. I'm considering ways to make this more of a plug-and-play style from the admin.
  • Images
    • From our find cats scripts
    • An incomprehensible heatmap: (images naturally have a lightbox)


  • Fasta Files: (a format for DNA/RNA/protein sequences)


  • Tabular Files:


Job Cloning:


Complex scripts may have several options to enable, a job can be cloned and its existing values will be pre-filled into a script for the user to submit.

And other obvious options like job deletion, resubmission, and downloading the contents of the job as a zip or tar.gz file.

Job Resubmission:

Made a stupid mistake in a script you uploaded? Fix the script, then you can simply resubmit the job.

Anything else?

Djangui is a work in progress. It supports ephemeral file systems, so you can use platforms such as Heroku with an Amazon S3 data store. This also allows you to host your worker on a separate node from your main web server. It also supports customization of the interface. If you know a bit of Django, you can override the template system with your own to customize its interface (or extend certain elements of it). Also, it is a pluggable app, meaning you can attach it to an existing Django project simply.

A Flask Alternative

In the time I was making this, another project emerged called Wooey which is based on Flask (ironically enough Martin also works in the scientific realm, so it seems we deal with similar issues). It has a slick interface, but has a few differences I went against such as storing the scripts as local json files instead of in the database. Thankfully, he chose a different avenue for loading scripts (using AST), which was a great boon for handling cases my approach to parsing argparse scripts would not cover. We have plans to release a library that is solely based on converting libraries such as argparse/clint to a standard markup for libraries such as Djangui and Wooey to utilize.

Pull requests and comments are welcome!

Friday, May 22, 2015

Minimizing render times of shared Django forms

A common situation with Django sites is the need to render a given form across all pages, such as a login-form that is embedded in the header. There is a recipe I came upon, probably from stackoverflow, that has some derivation of the following pattern:

# as a context_processor
from .forms import SomeLoginForm

def loginFormProcessor(request):
    ctx = {}
    if not request.user.is_authenticated():
        ctx['login_form'] = SomeLoginForm
    return ctx

# your template
{% if not request.user.is_authenticated %}
    {% crispy login_form %}
{% endif %}

I was using this pattern for a rather complicated form without thinking about the overhead incurred. However, when new-relic revealed this was taking ~600 ms per render, I knew it had to be fixed.

 The simplest solution is template caching, making our template look like so:

# your template
{% load cache %}
{% if not request.user.is_authenticated %}
  {% cache 99999 login_form_cache %}
    {% crispy login_form %}
  {% endcache %}
{% endif %}


The problem with this is we still incur the overhead in our context processor. We can avoid this by doing all our work within the cache tag. First, we need to move the logic of generating the form out of the context processor and into a template_tag.

# our template_tag.py file
@register.assignment_tag
def get_login_forms():
    from ..forms import StepOne, StepTwo, StepThree
    ctx = {}
    ctx['first'] = StepOne
    ctx['second'] = StepTwo
    ctx['third'] = StepThree
    return Context(ctx)

Now, we need to integrate this tag into our text, so our final template looks like the following (this is also more related to my particular example where I have a multi-stepped form):

# our template file
{% load cache our_tags %}
{% if not request.user.is_authenticated %}
  {% cache 99999 login_form_cache %}
    {% get_login_forms as modal_login_forms %}
    {% crispy modal_login_forms.first %}
    {% crispy modal_login_forms.second %}
    {% crispy modal_login_forms.third %}
  {% endcache %}
{% endif %}

This alone made the server response time come from ~2-3  seconds down to 0.69 seconds.  Not too shabby.

Note: This code should run but I didn't test it as it isn't exactly my code copy & pasted, but an example.

Wednesday, May 20, 2015

Nested Heatmaps in Pandas

I kind of hate heatmaps . They look pretty, but they don't really mean anything. There are so many ways to torture your distance matrix to give you wildly different results, that I often just skip over them in papers. But, biologists love heatmaps. So, here I am.

A recent request way to make a nested heatmap. Basically we want to cluster things by one distance matrix, then show the sub-components of that component under it.

For instance, we have a heatmap that is clustered by genes.


We can see there is differential expression here, such as HLA-A in low in the brain and HLA-C is high in leukocytes. However, genes are made of transcripts -- sometimes there are single transcripts, sometimes there can be hundreds (or in drosophila, tens of thousands). We want to know what is the real signal driving the values measured at the gene level.

To do this, we wanted a heatmap that then showed what makes up each gene.

To accomplish this, here is a generic piece of code that groups things on a 'major index' and plots the 'minor index'.

%matplotlib qt
import numpy as np
import pandas as pd
major_index = 'Gene name'
minor_index = 'Ensembl ID'
# let's use a big dataset that is public, the illumina human bodymap summarized here:
# http://genomicdbdemo.bxgenomics.com/bxaf6/genomicdb/search_all.php?t=tbl_genomicdb_usr_search_131889_92&s=1
df = pd.read_table('/home/chris/Downloads/Human Body Map.csv', sep='\t', index_col=[major_index, minor_index])
# remove the description column
del df['Description']
# This is a bunch of random data pieced together
# some data pre-processing
df = np.log2(df)
# set our undected samples to our lowest detection
df[df==-1*np.inf] = df[df!=-1*np.inf].min().min()
# translate our data so we have no negatives (which would screw up our addition and makes no biological sense)
df+=abs(df.min().min())
major_counts = df.groupby(level=[major_index]).count()
# we only want to plot samples with multiple values in the minor index
multi = df[df.index.get_level_values(major_index).isin(major_counts[major_counts>=2].dropna().index)]

import seaborn as sns
# Let's select the most variable minor axis elements
most_variable = multi.groupby(level=major_index).var().mean(axis=1).order(ascending=False)
# and select the top 10
dat = multi[multi.index.get_level_values(major_index).isin(most_variable.index[:10])]
# we want to cluster by our major index, and then under these plot the values of our minor index
major_dat = dat.groupby(level=major_index).sum()
seaborn_map = sns.clustermap(major_dat, row_cluster=True, col_cluster=True)
# now we keep this clustering, but recreate our data to fit the above clustering, with our minor
# index below the major index (you can think of transcript levels under gene levels if you are
# a biologist)
merged_dat = pd.DataFrame(columns=[seaborn_map.data2d.columns])
for major_val in seaborn_map.data2d.index:
    minor_rows = multi[multi.index.get_level_values(major_index)==major_val][seaborn_map.data2d.columns]
    major_row = major_dat.loc[major_val,][seaborn_map.data2d.columns]
    merged_dat.append(major_row)
    merged_dat = merged_dat.append(major_row).append(minor_rows)
merged_map = sns.clustermap(merged_dat, row_cluster=False, col_cluster=False)

# recreate our dendrogram, this is undocumented and probably a hack but it works
seaborn_map.dendrogram_col.plot(merged_map.ax_col_dendrogram)

# for rows, I imagine at some point it will fail to fall within the major axis but fortunately
# for this dataset it is not true
seaborn_map.dendrogram_row.plot(merged_map.ax_row_dendrogram)


From this, we can see interesting aspects. Such as the wide variety of isoforms with HLA-A.  We can see there is a mixture of transcript classes being expressed here, and it is very different across tissue (note: I believe this is probably an artifact of sequence alignment and not true if there are any biologists reading this, this is just to illustrate a point.). We also see that FLOT1 has an isoform expressed solely in lymphocytes.

This looks quite nice on my own data, and is a fairly useful way to create quick graphics showing the general trend of your data (gene level) and being able to visually illustrate to others the underlying components.